How much money does Fall Fest make, or sometimes lose? Where does the money come from (income)? And where does it go (expenses)?
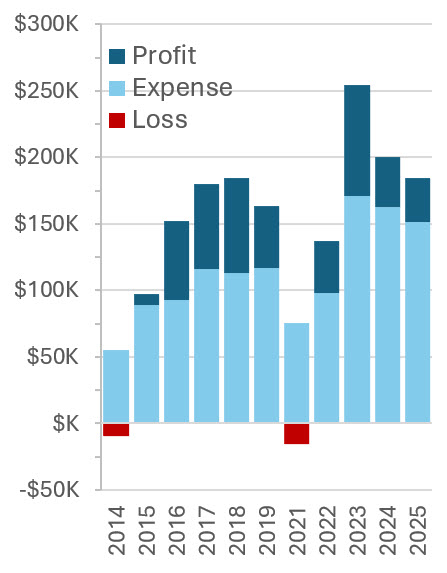
Here we provide answers based on the years with available records: the eleven years from 2014 to 2025, omitting 2020 when Fall Fest was cancelled due to Covid but including 2021 when Fall Fest was delayed due to a hurricane warning.
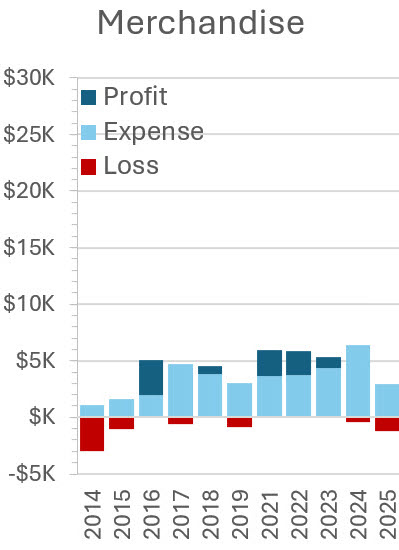
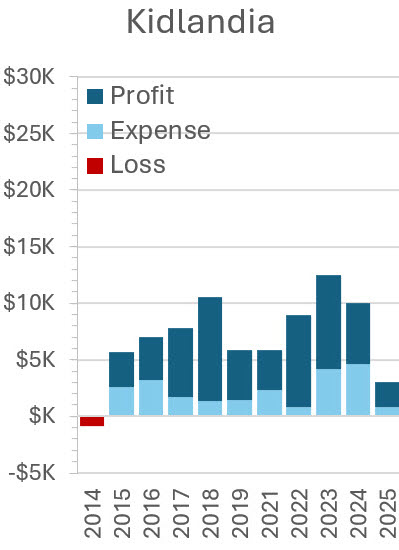
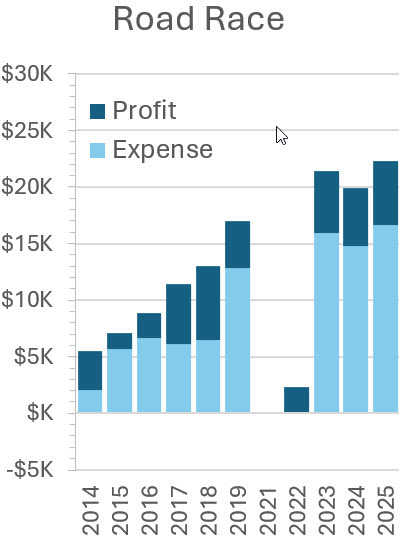
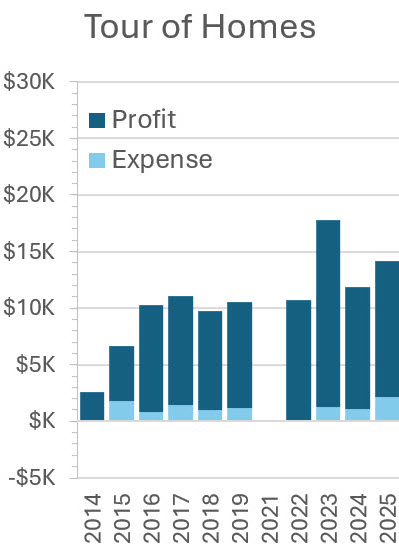
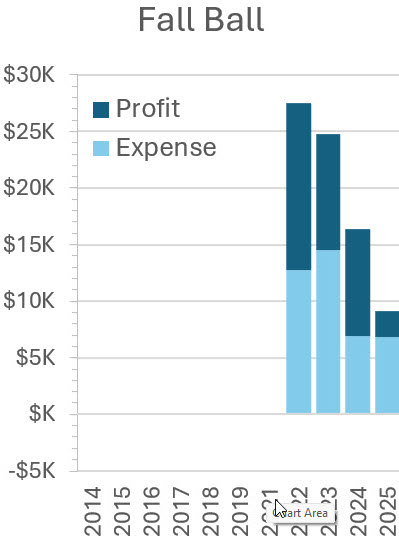
In In this figure, the dark blue portion at the top of these bars indicates profit (most years). The red portion at the bottom indicates loss (2014 and 2021). For years with a profit, the height of the bar indicates income and the light blue portion indicates expenses. For years with a loss, the light blue portion indicates income and the entire bar (including the red portion) indicates expenses.
Income – Where Does the Money Come From?
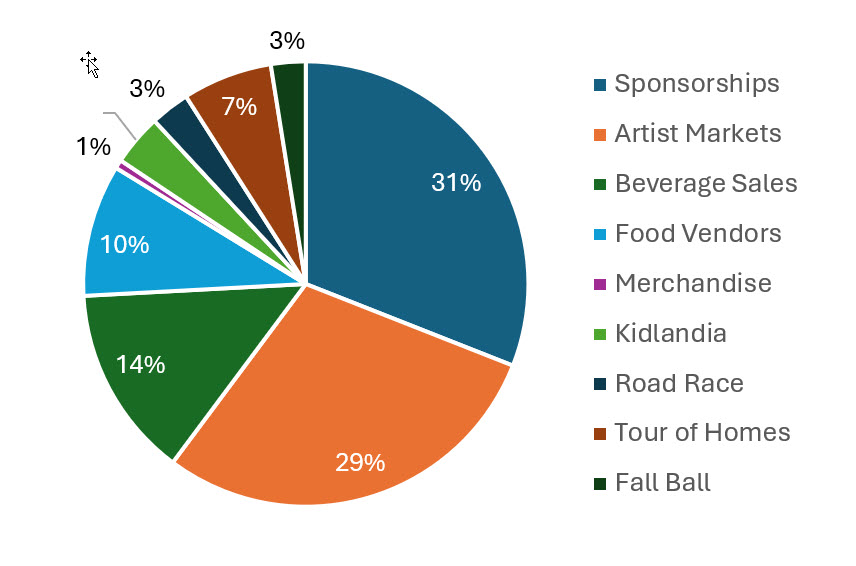
Pooling over these 11 years, the most revenue has come from general sponsorships and the artist markets followed by beverage sales and food vendors, for a total of 84%. The remaining 16% represents profits from merchandise, kidlandia, and the Road Race, Tour of Homes, and Fall Ball (Fall Ball contributed only the last three years).
Expenses – Where Does the Money Go?
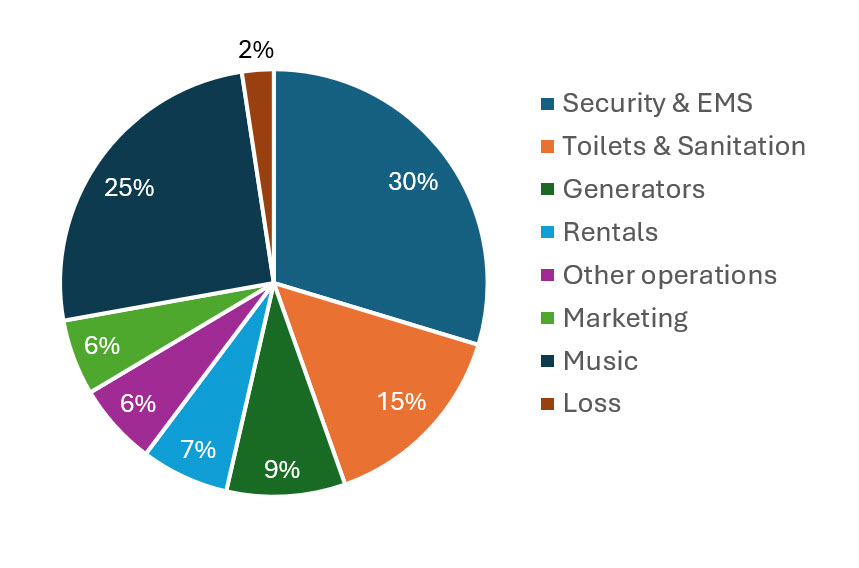
Pooling over these 11 years, the biggest operational expense is security followed by toilets and generators. All together, operational costs (including rentals and marketing) total 72% and music 26%; the remaining 2% indicates loss.
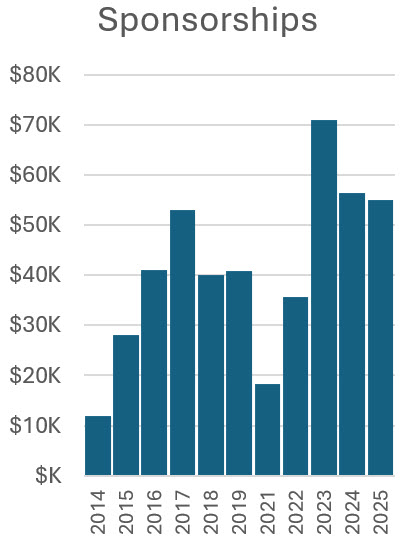
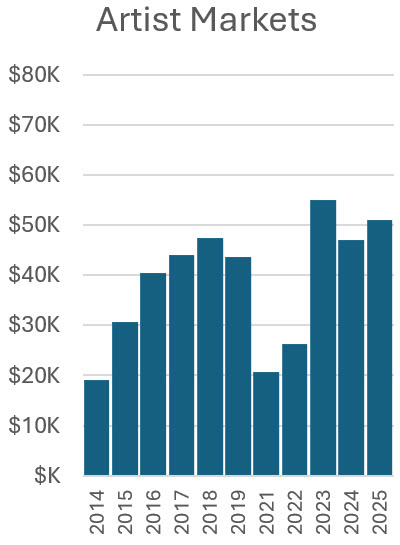
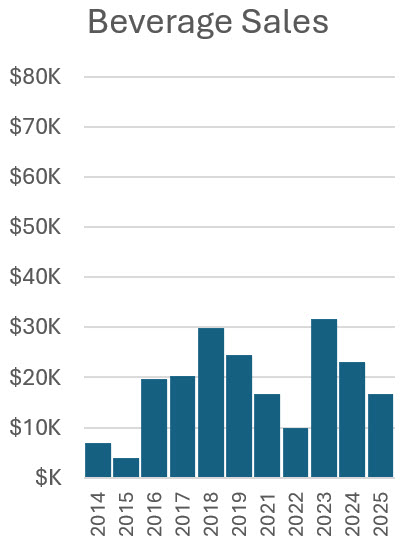
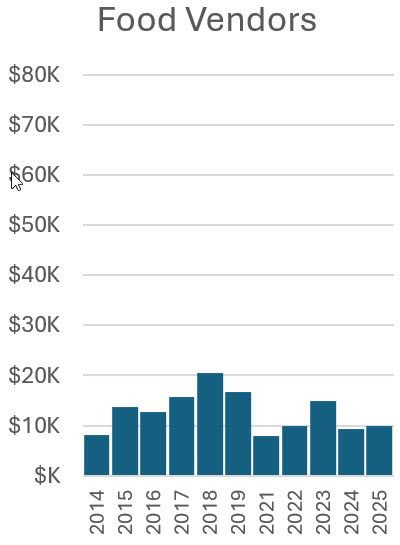
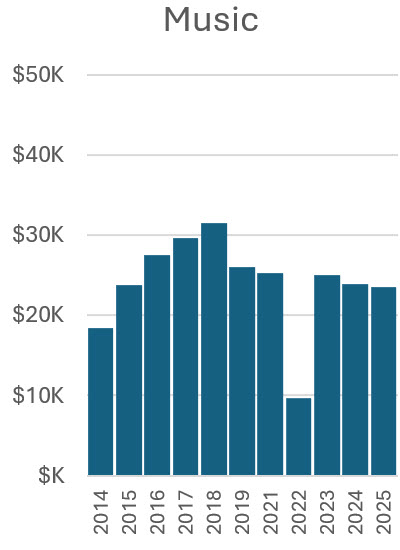
Income Year by Year
These figures show the revenue year by year for the four major sources of income. Sponsorships are general for Fall Fest and not for a specific activity or event (like Tour of Homes or Fall Ball).
These figures show the profit (or loss) year by year for other sources of income. For years with a profit, the height of the bar indicates income and the light blue portion indicates expenses. For years with a loss, the light blue portion indicates income and the entire bar (including the red portion) indicates expenses. Income for these sources includes, e.g., ticket sales and specific sponsorships.
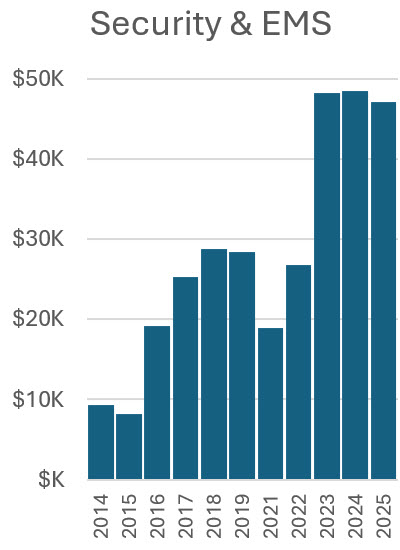
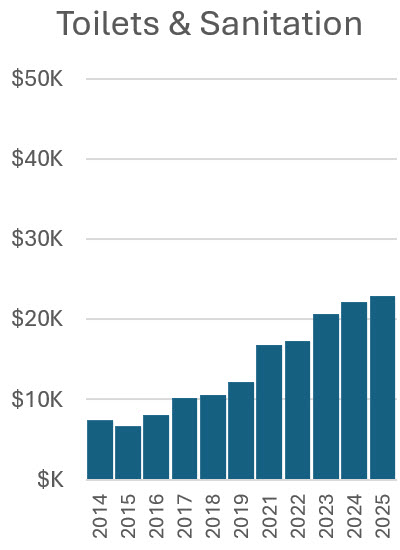
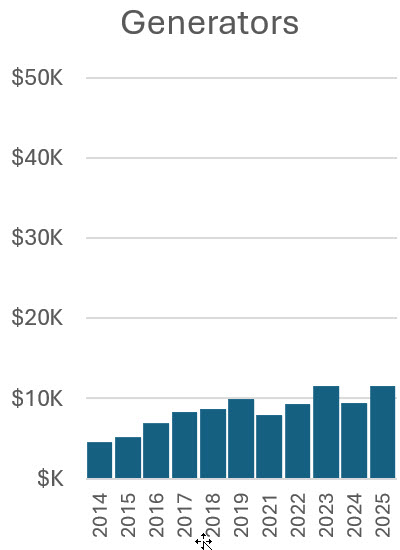
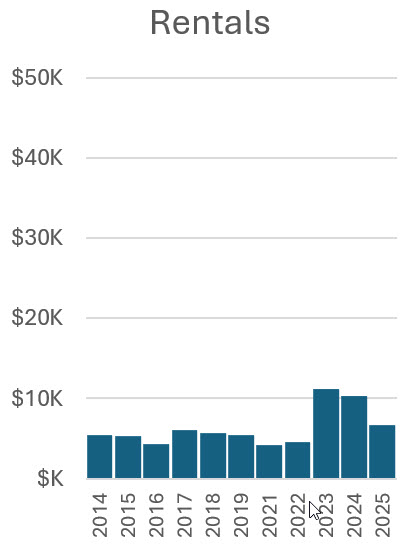
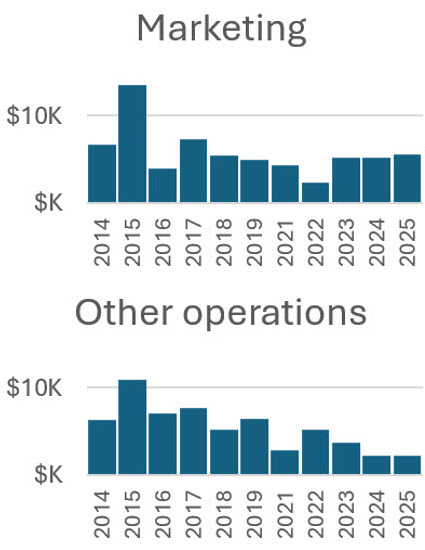
Expenses Year by Year
These figures show the expenses year by year for sources not associated with specific income. Noteworthy are increases in security and toilets, especially since 2023 for security, and the relative stability of other costs. Expenses for sources associated with specific income (merchandise, kidlandia, road race, tour of home, and fall ball) are shown in the earlier figures indicating their profits.
Figures and prose by Roger Bakeman